
Sentiment Analysis: Comparing Azure, AWS, and Custom Fine-Tuned Models
I ran 22,719 student evaluations through five sentiment models side by side — Azure’s cloud API, AWS Comprehend, a pre-trained RoBERTa model, Microsoft’s Phi-2, and fine-tuned versions of the last two. The cloud APIs weren’t just less accurate than the custom models. They were classifying the same feedback in ways that would’ve pointed a business in the wrong direction.
The numbers were stark. Azure called over 40% of reviews “mixed” sentiment — a label the human reviewers barely used. AWS did the same thing. Both APIs took a dataset that was mostly positive and negative with a thin neutral middle and smeared it into a shape the ground truth — the human-labeled answers I treated as correct — didn’t recognize.
I went into this expecting the fine-tuned models to win. What I didn’t expect was by how much. The gap is wide enough that I’m now telling clients the same thing: if sentiment classification matters to your business, build a custom model. Fine-tuning a Transformer — the neural network architecture behind modern language AI — is doable with as few as 20,000 labeled examples. Skip the API.
Let me walk through what I actually built.
The dataset
I used a publicly available dataset designed for aspect-based sentiment analysis — sentiment detection applied to specific dimensions of something, in this case teacher performance. The data came from student feedback collected at American International University-Bangladesh, labeled by undergraduates into three categories: positive, negative, and neutral. After cleaning, the full dataset contains over 2 million records.
I worked with a filtered subset of 22,719 — specifically, entries where students wrote more than 200 characters. Short one-liners are too easy to classify and would inflate the scores.
The dataset includes several columns I didn’t use: a numerical rating, a pre-trained model’s sentiment guess, subjectivity classifications and scores, and a boolean flag for whether the manual and pre-trained labels matched. I only needed StudentComments (the free-form text) and Sentiment (the human label). Everything else sat untouched.
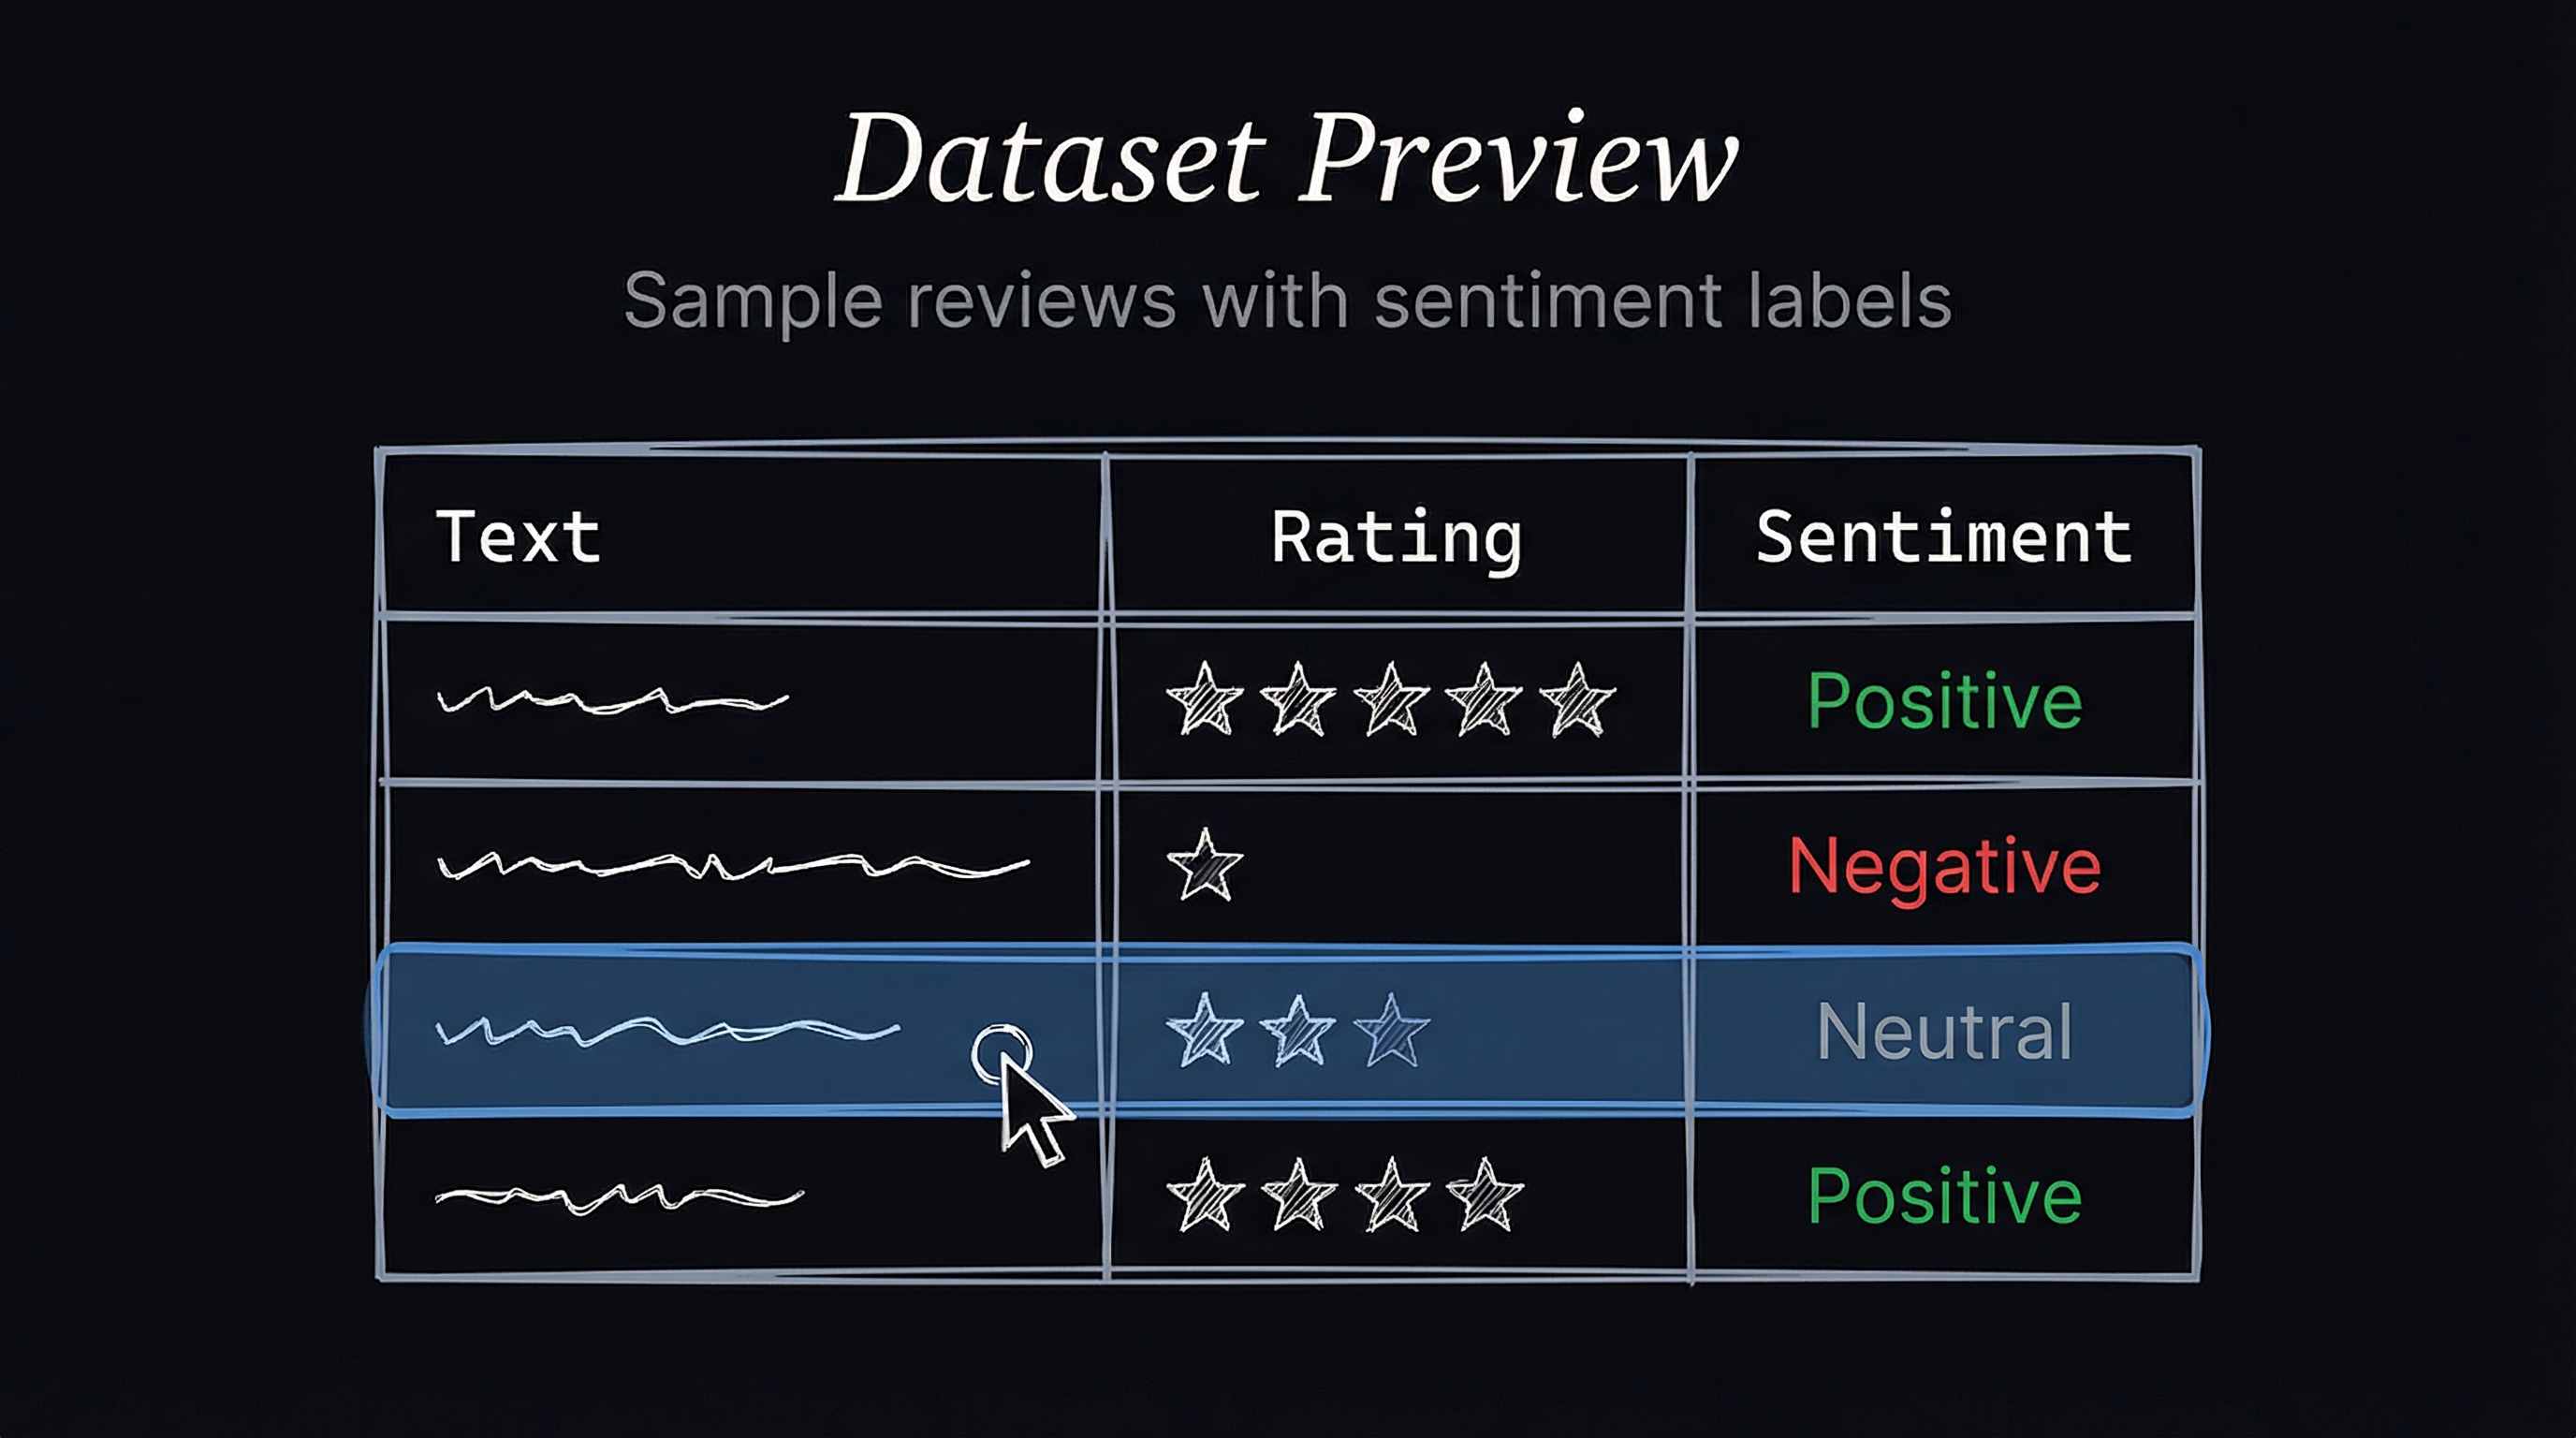
Figure-1: Dataset preview
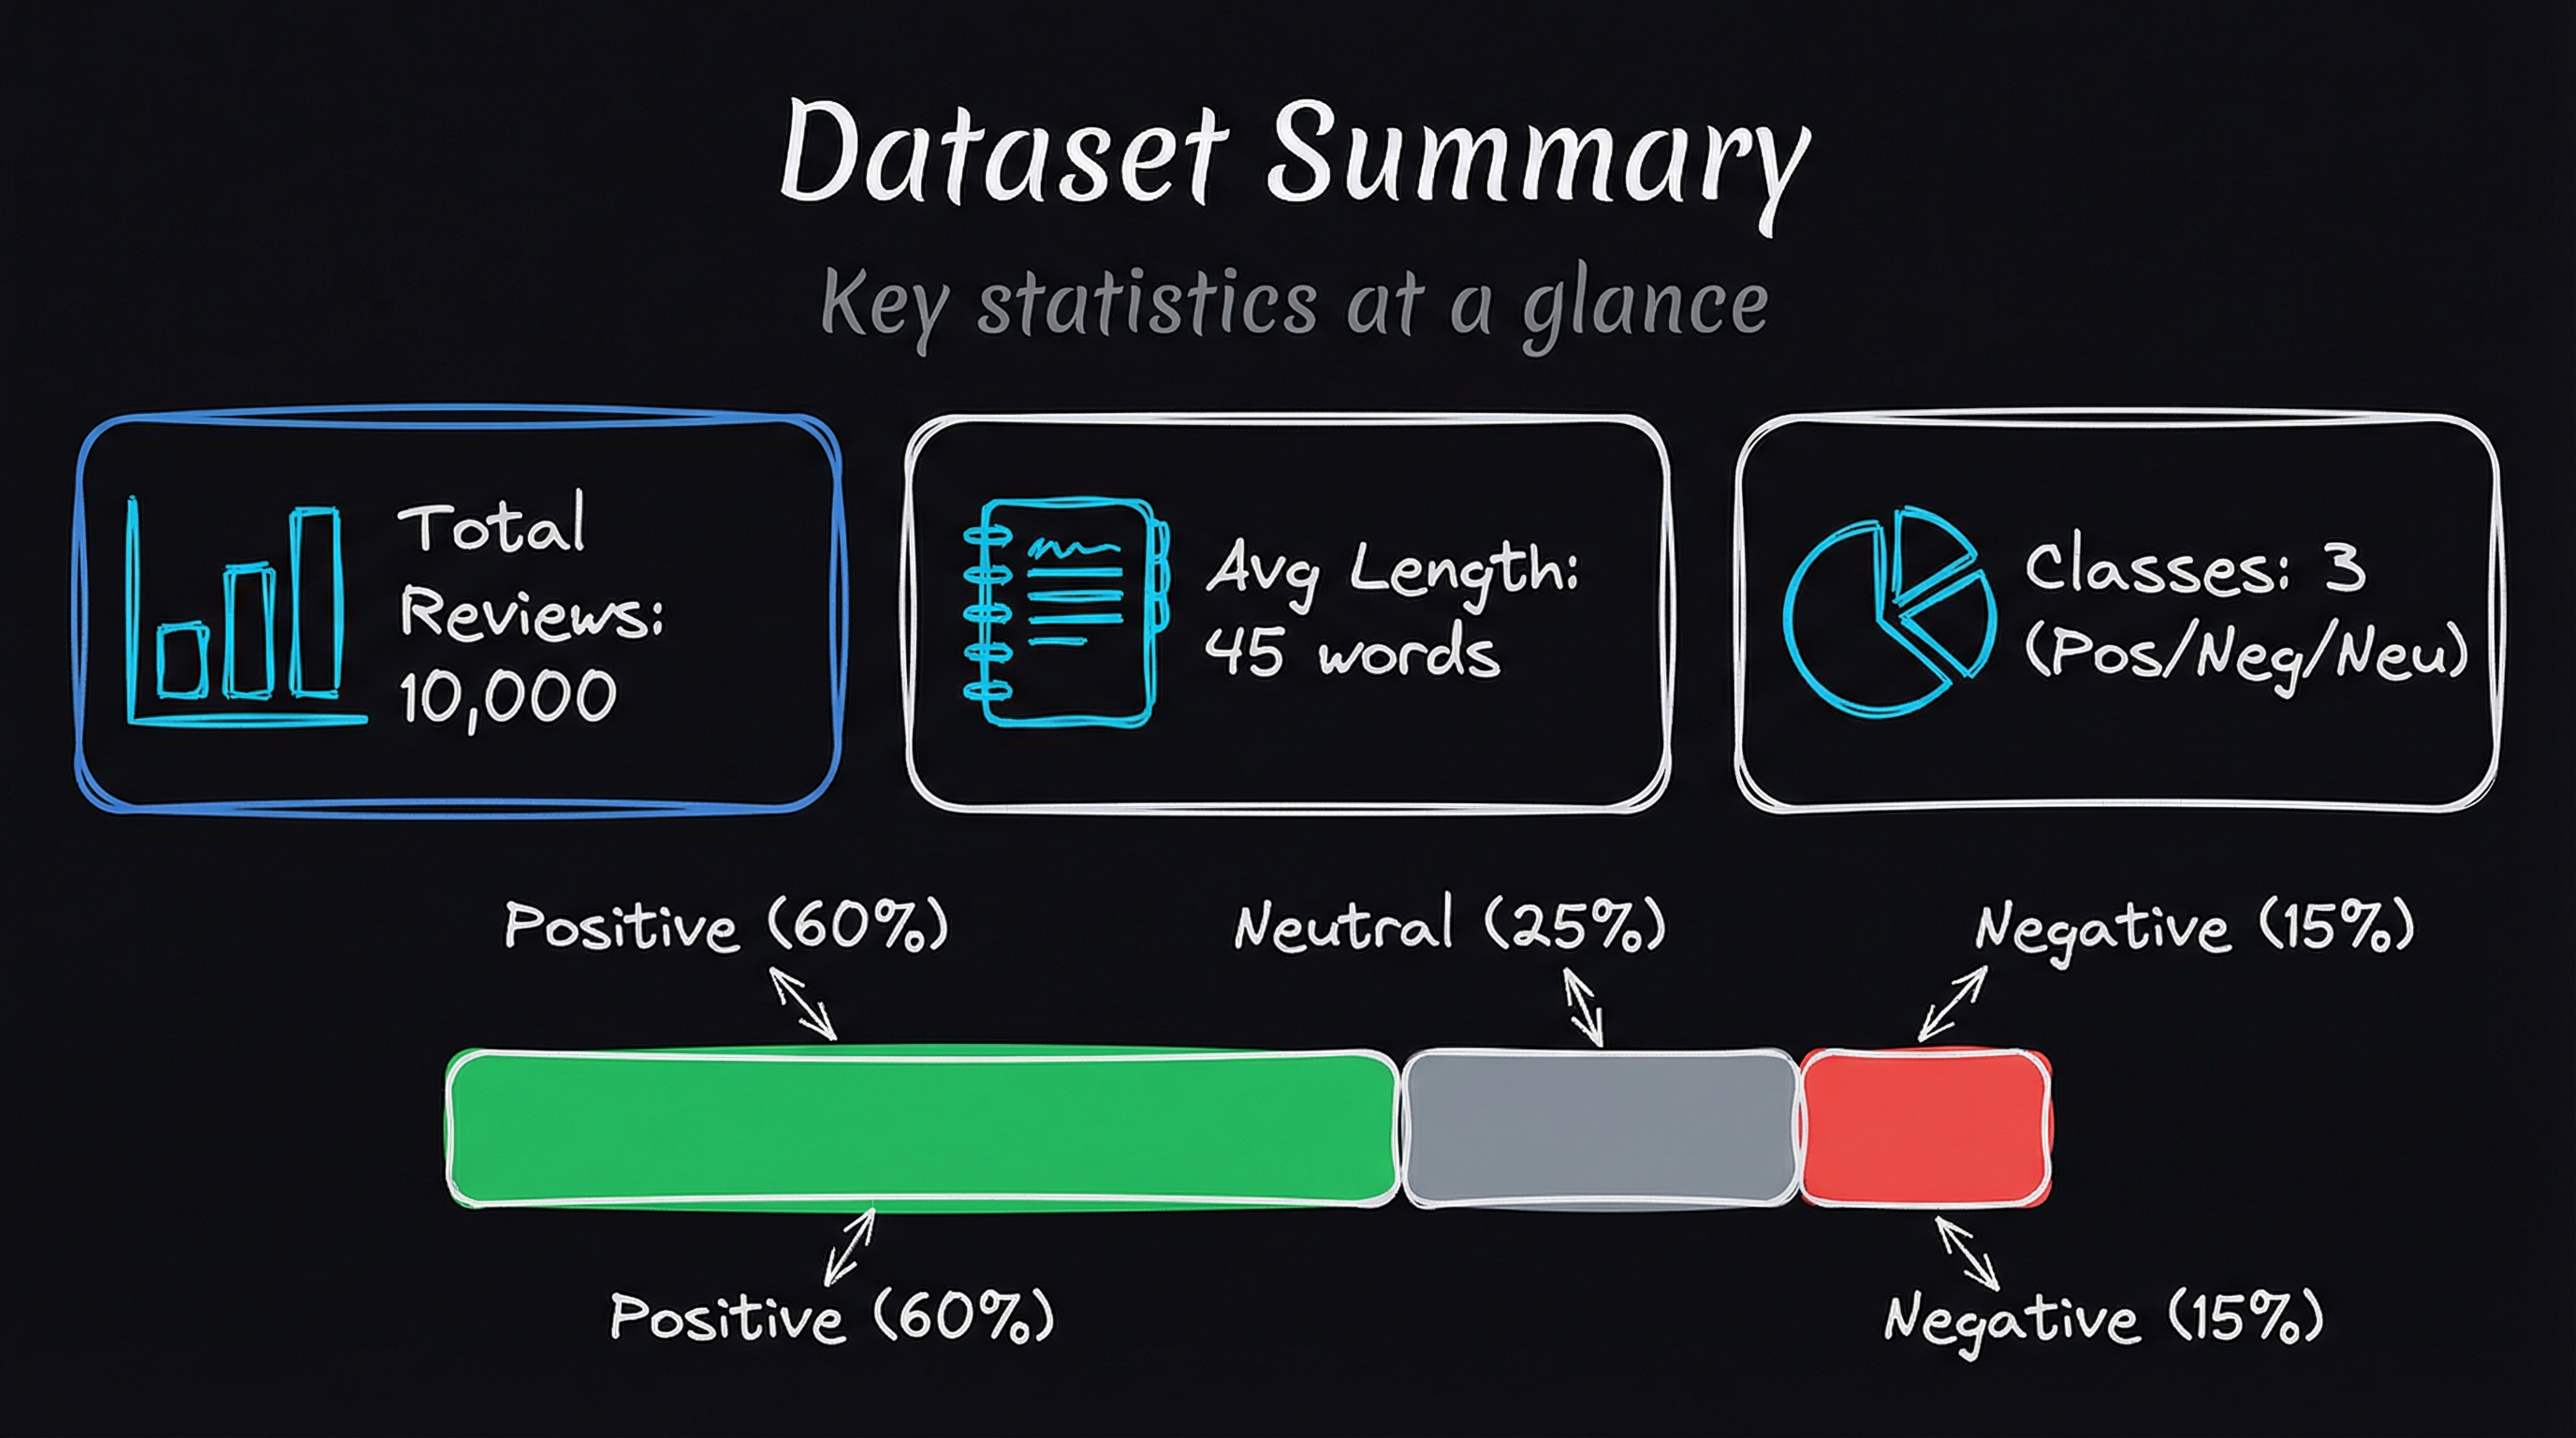
Figure-2: Dataset summary
Before training anything, I checked whether the labels actually made sense. The box plot confirmed exactly what you’d hope: positive sentiment clustered around high ratings (4–5), negative clustered low with a wider spread, and neutral sat squarely in the middle. The scatter plot showed the same pattern across comment length — sentiment tracked ratings regardless of how many words the student wrote.
The labels weren’t noise. That matters, because if the ground truth is sloppy, every comparison downstream is meaningless.
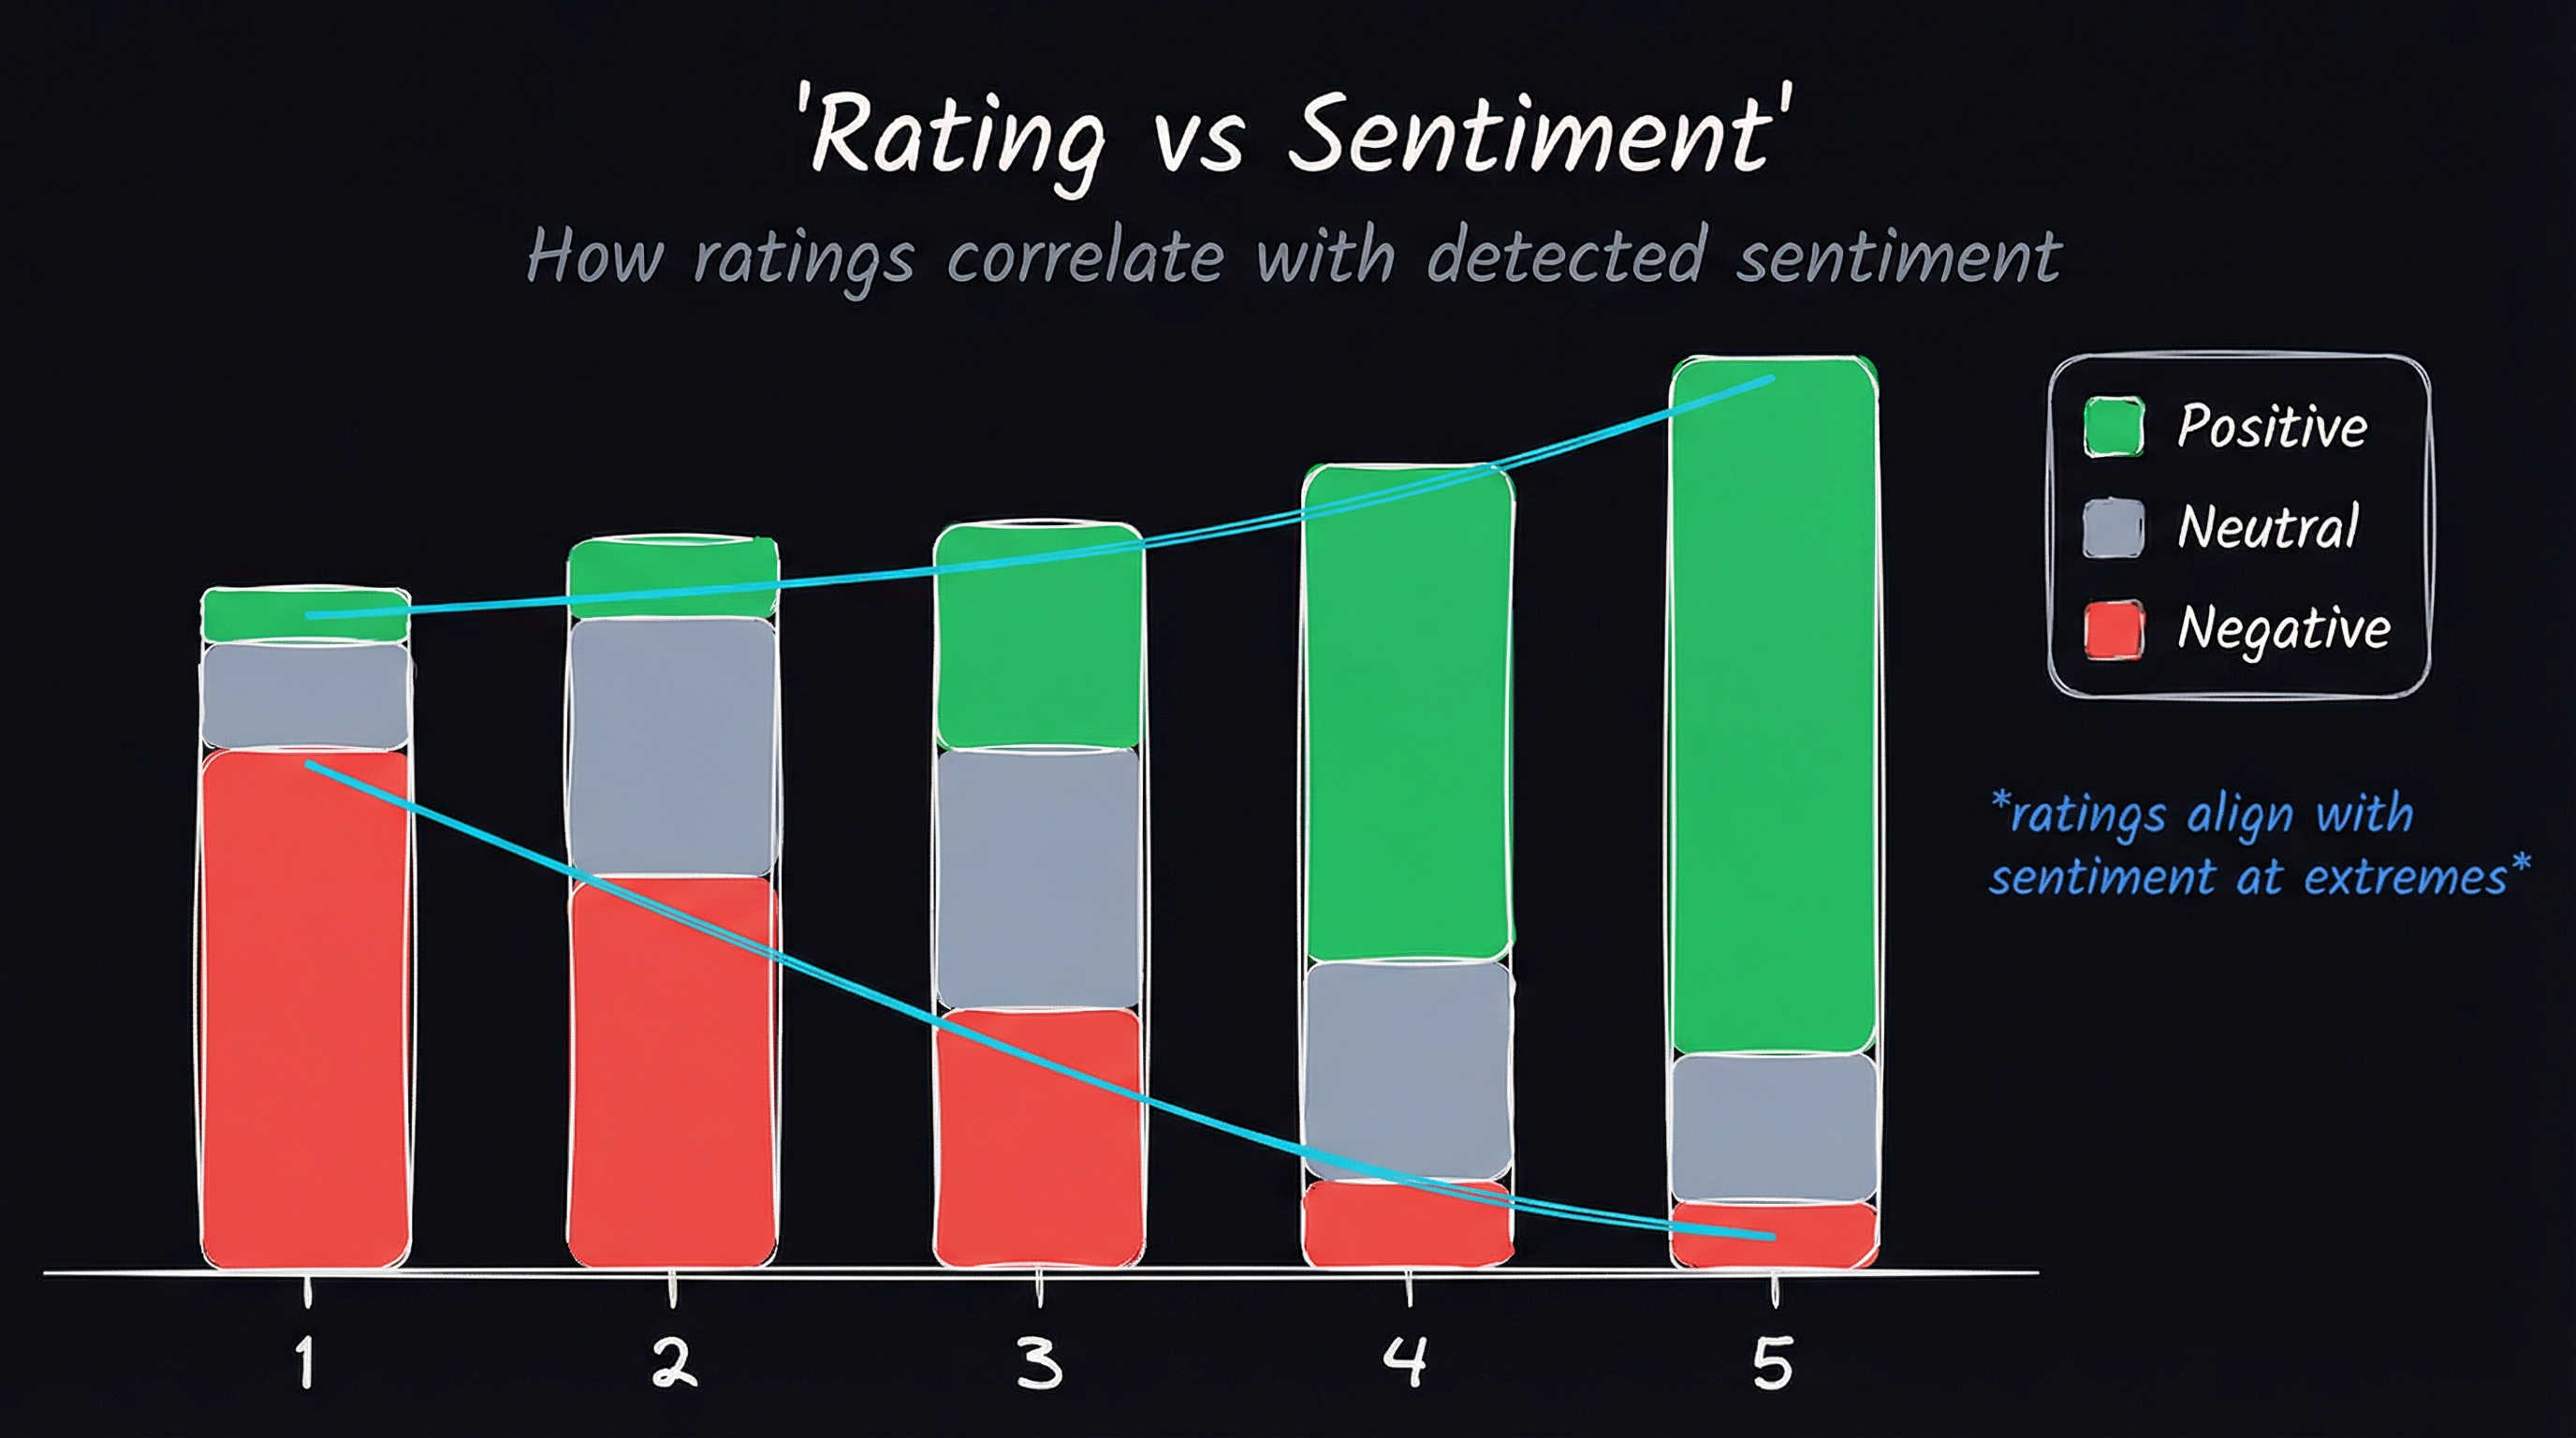
Figure-3: Relationship between Rating and Sentiment
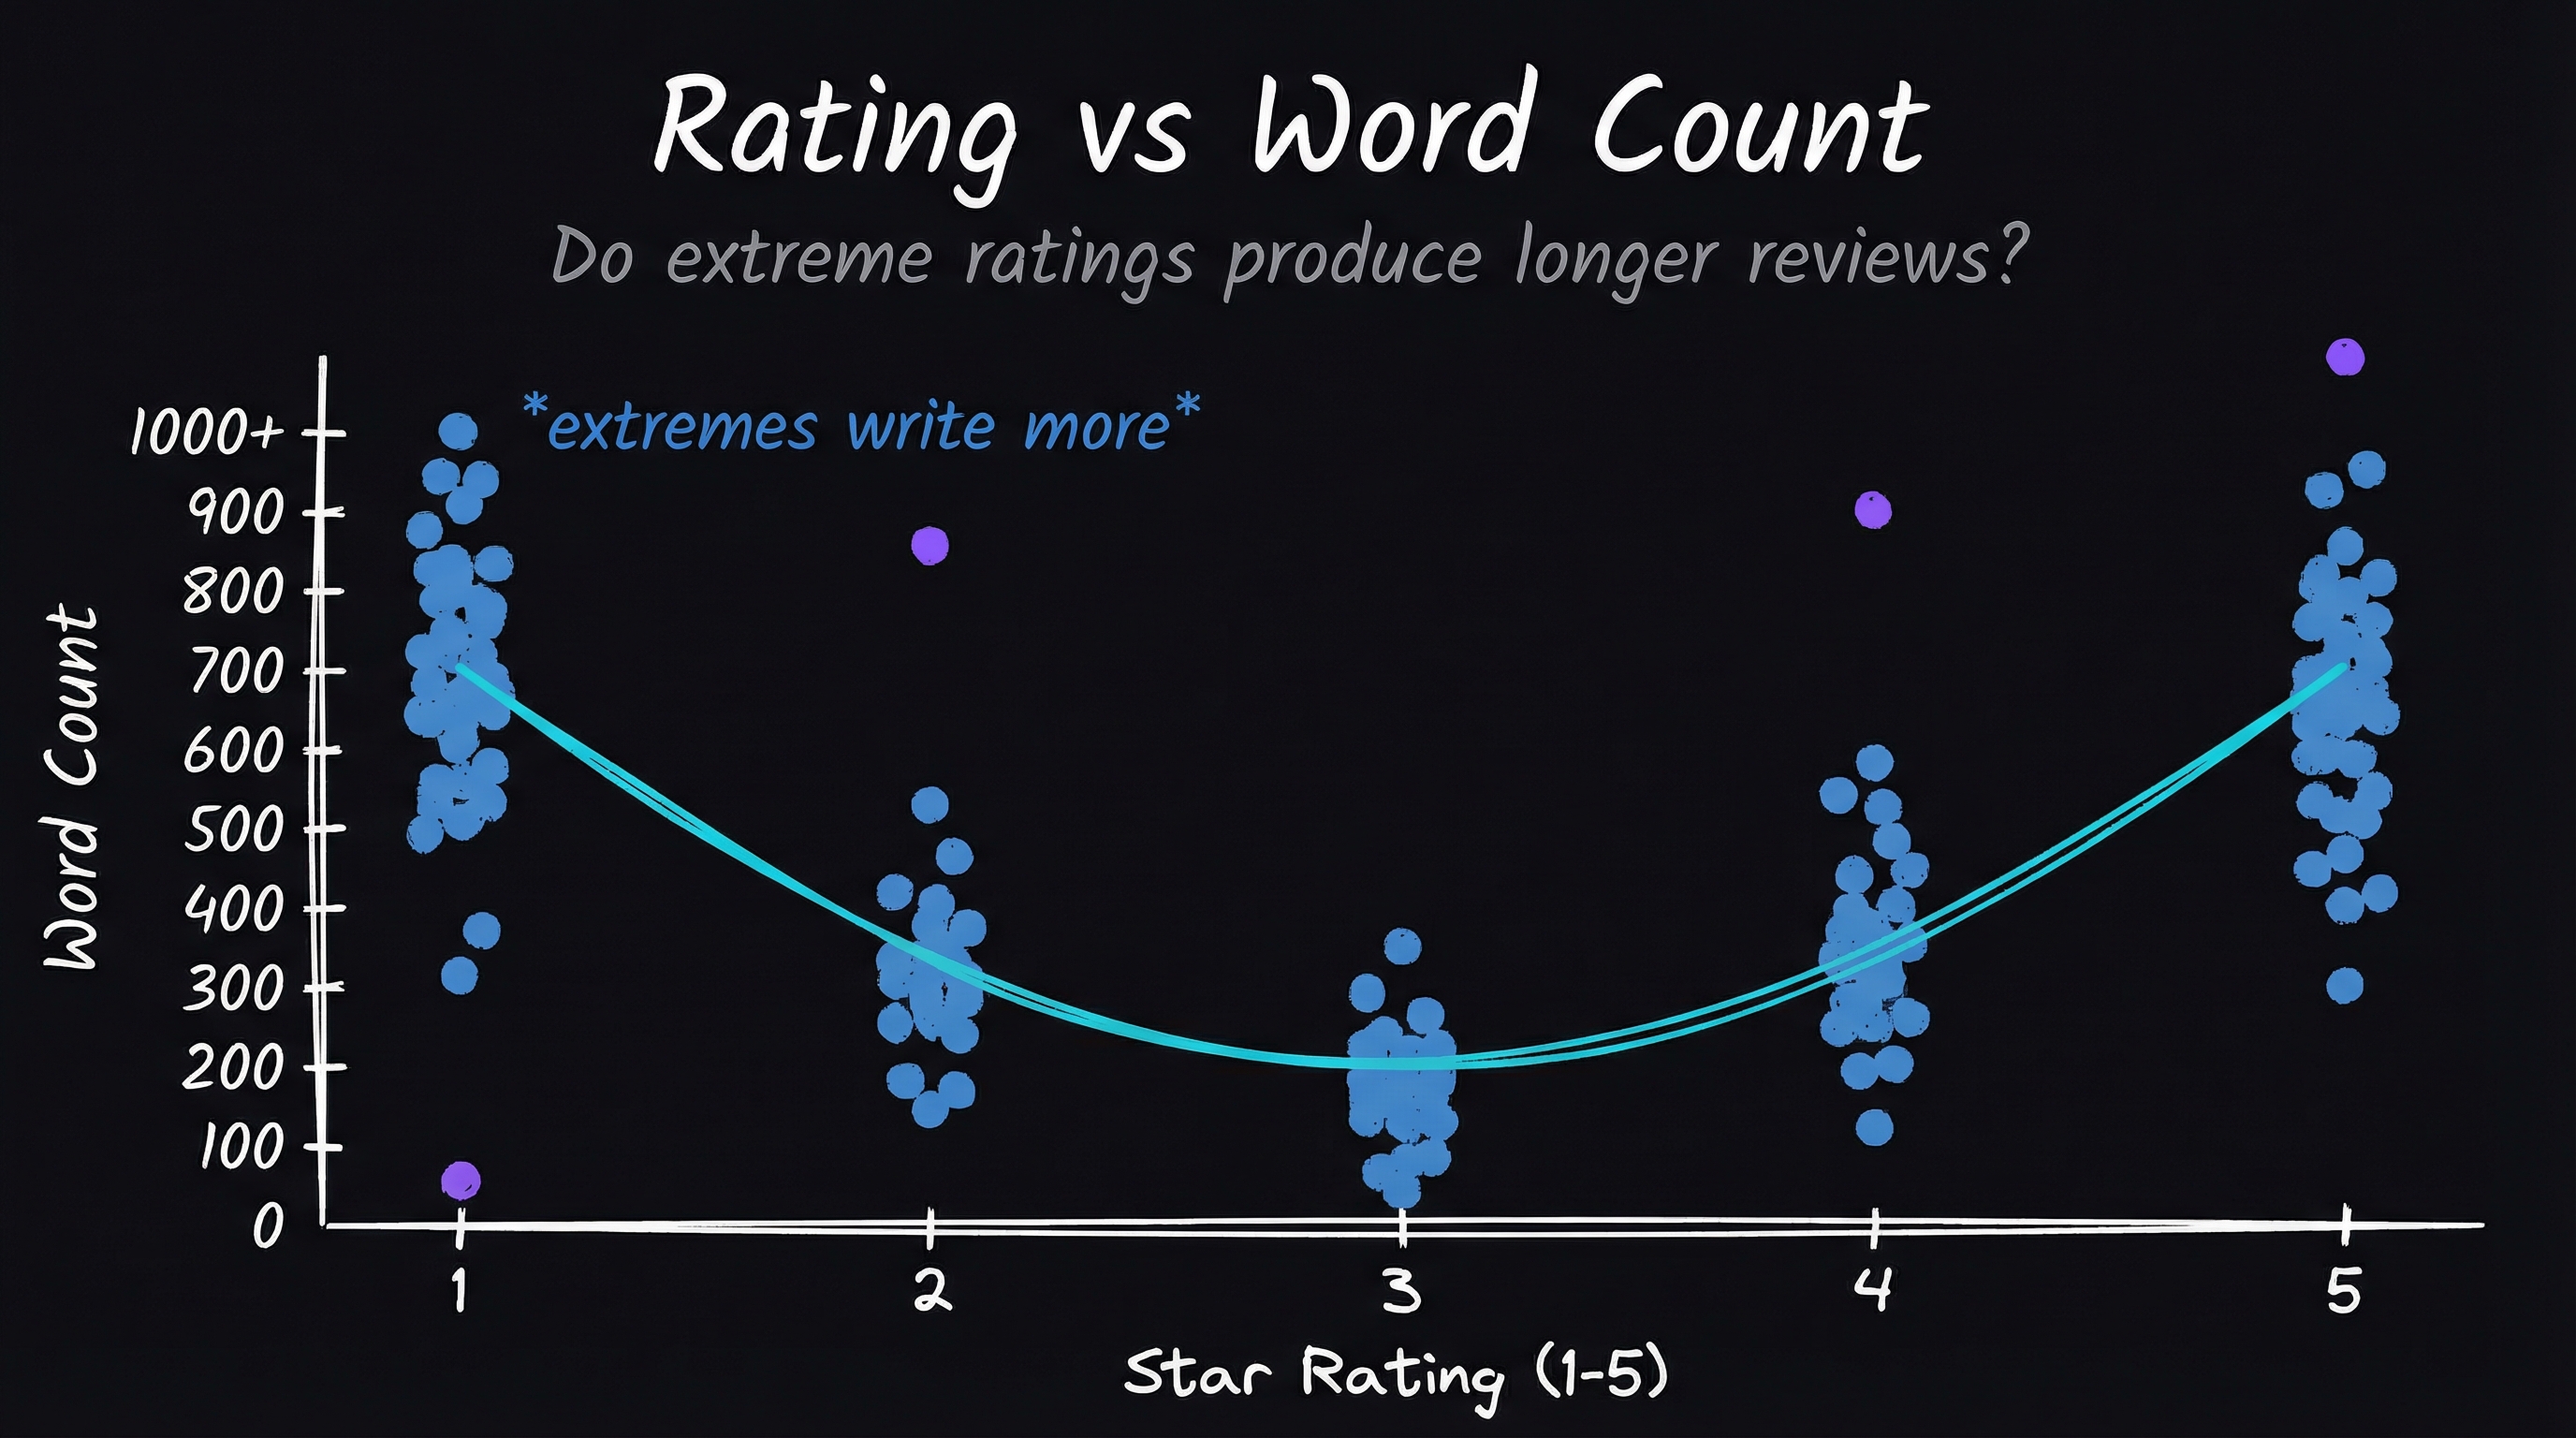
Figure-4: Rating vs. Total Words with Sentiment
What I compared
Five approaches, three categories.
Cloud APIs. Azure Cognitive Text Analytics and AWS Comprehend. Both are services where you send text to an endpoint and get a sentiment label back — no training, no configuration beyond an API key. Azure integrates smoothly if you’re already in Microsoft’s ecosystem. AWS scales well if you have volume. These are the path of least resistance, and that’s exactly what makes them tempting to reach for first.
Off-the-shelf models. RoBERTa and Phi-2, straight off Hugging Face with no additional training. RoBERTa — cardiffnlp/twitter-roberta-base-sentiment-latest — came with an edge: it was already fine-tuned on roughly 124 million tweets from January 2018 through December 2021, using the TweetEval benchmark. So it had seen sentiment classification before. It just hadn’t seen my data. Phi-2 — microsoft/phi-2 — is a Transformer with 2.7 billion parameters (meaning 2.7 billion adjustable weights inside the model). It was trained on the same data sources as Phi-1.5 plus synthetic NLP texts and filtered web content. It demonstrated near state-of-the-art performance among models with fewer than 13 billion parameters on benchmarks testing common sense, language understanding, and logical reasoning. Critically, this version of Phi-2 was never fine-tuned through reinforcement learning from human feedback — it shipped raw, so the research community could explore safety challenges like toxicity reduction and bias control on an unrestricted small model. I included it untuned on purpose, to see what baseline performance looked like.
The original Twitter-based RoBERTa model lives here and the reference paper is TweetEval.
Fine-tuned models. Same RoBERTa and Phi-2, but trained further on my 22,719 labeled evaluations. This is the custom path: you take a general-purpose language model and teach it your specific classification task. The model keeps everything it learned during its original training — word meanings, sentence structure, world knowledge — but adjusts its weights to get better at your particular job.
What I measured
Three lenses, because accuracy alone hides too much.
Sentiment distribution. I compared how each model spread its predictions across positive, negative, neutral, and mixed against the ground truth. If a model’s distribution is a different shape from the truth, it’s misclassifying systematically — not just making random errors. That’s bias a single accuracy number won’t surface.
F1 score. The standard measure that balances precision and recall. Precision answers: when the model says “positive,” how often is it right? Recall answers: of all the actual positives, how many did the model catch? F1 is the harmonic mean of the two — it punishes models that are good at one and terrible at the other. Range is 0 to 1. Models scoring above 0.85 are generally considered production-ready.
Agreement analysis. How often do two models give the same answer to the same input? High agreement between independent models suggests the classification is unambiguous. Low agreement means at least one of them is guessing differently — and you don’t know which.
What I found
The distribution charts were the first shock.
The ground truth had a clear shape: mostly positive, a solid block of negative, a thin band of neutral. Azure and AWS both overproduced “mixed” sentiment — a label the human reviewers barely used — and underproduced neutral. They were inventing a distribution that didn’t match the data.
The pre-trained RoBERTa aligned more closely with the ground truth on positive sentiment but still underestimated neutral. Its prior fine-tuning on Twitter data gave it a real head start — it already understood what sentiment labels look like. Raw Phi-2, by contrast, was nearly useless. It struggled to classify most of the data correctly. Its bars in the distribution chart were barely visible. That’s expected: Phi-2 had never been trained for sentiment. It was a general-purpose model doing a specific task with zero task-specific preparation.
Fine-tuning fixed both. Fine-tuned RoBERTa tightened its alignment with the ground truth, particularly for positives, though it still undercounted neutral. Fine-tuned Phi-2 was the best model in the field — it matched the ground truth distribution almost exactly. The improvement over fine-tuned RoBERTa was incremental but real.
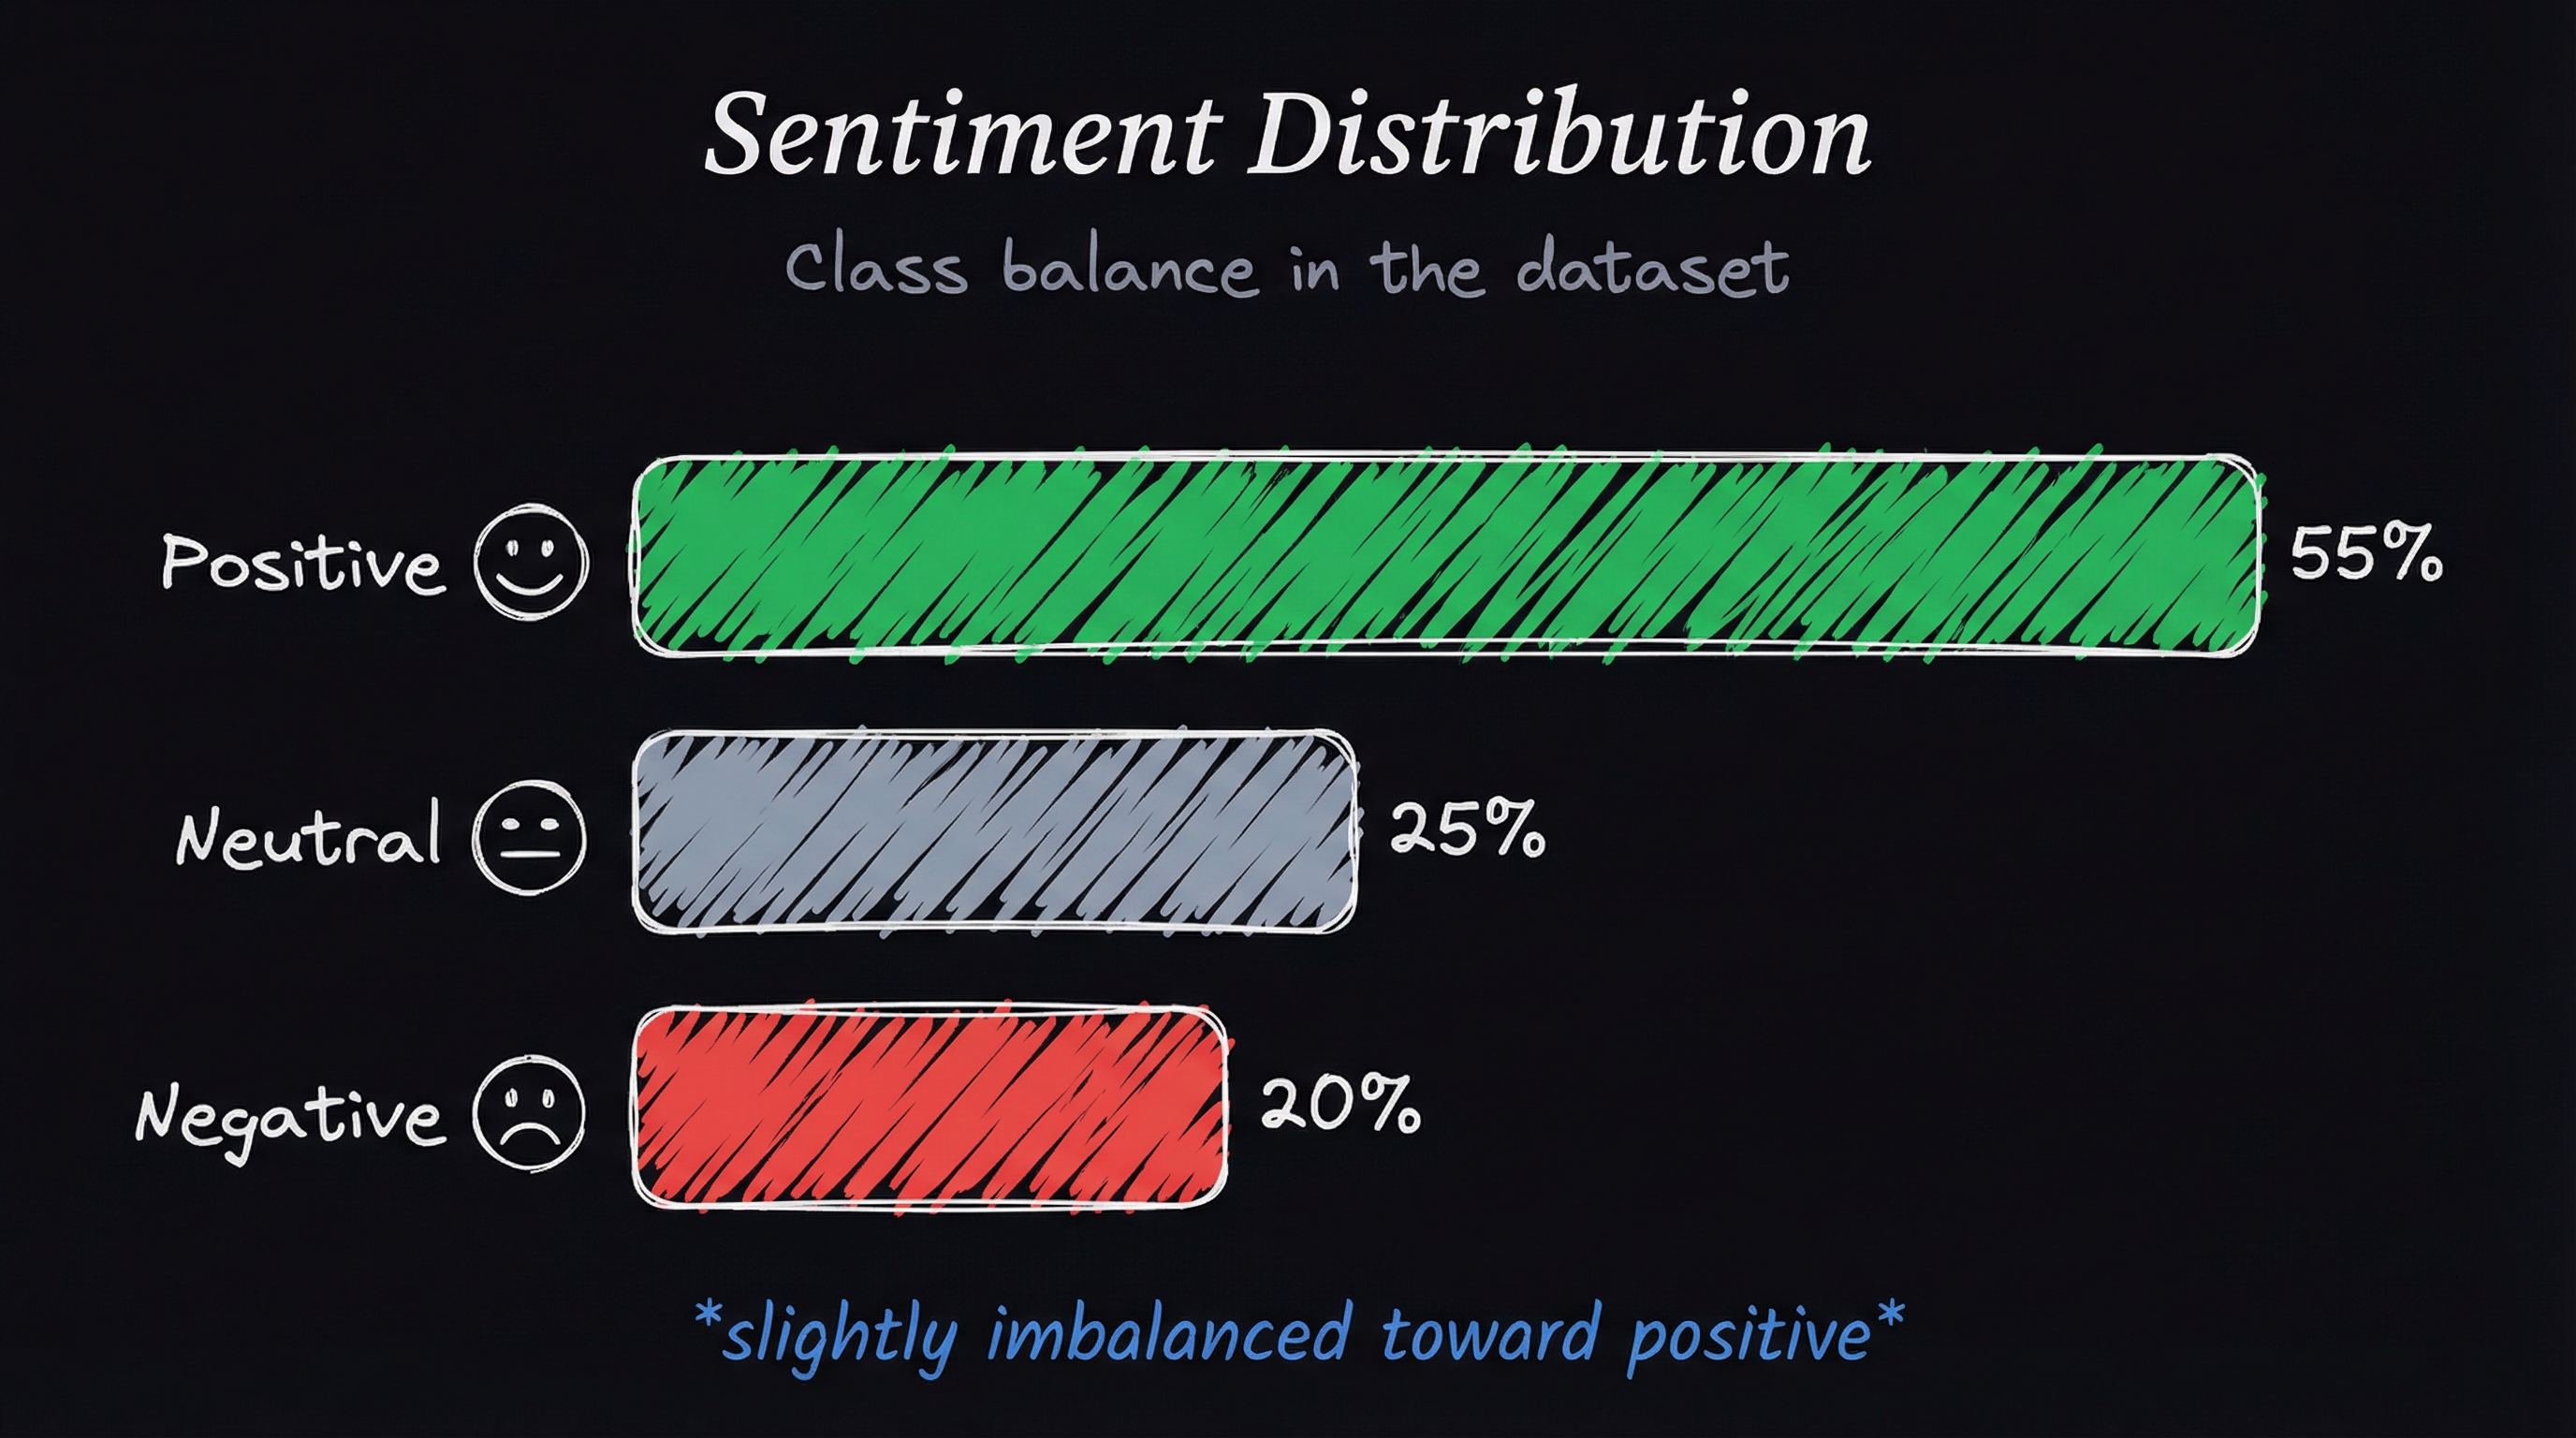
Figure-6: Sentiment Distribution
Then the F1 scores.
AWS was my benchmark — the baseline I measured everything against. Azure scored lower. Pre-trained RoBERTa beat both cloud APIs, which makes sense given its Twitter sentiment background. Pre-trained Phi-2 was the worst performer, as expected.
Fine-tuned RoBERTa jumped ahead of the cloud APIs by a wide margin. Fine-tuned Phi-2 was the clear winner — it significantly outperformed AWS, Azure, and even fine-tuned RoBERTa in accuracy, precision, recall, and F1 score. The gap between the best cloud API and the best fine-tuned model wasn’t close. It was the difference between “usable” and “reliable.”
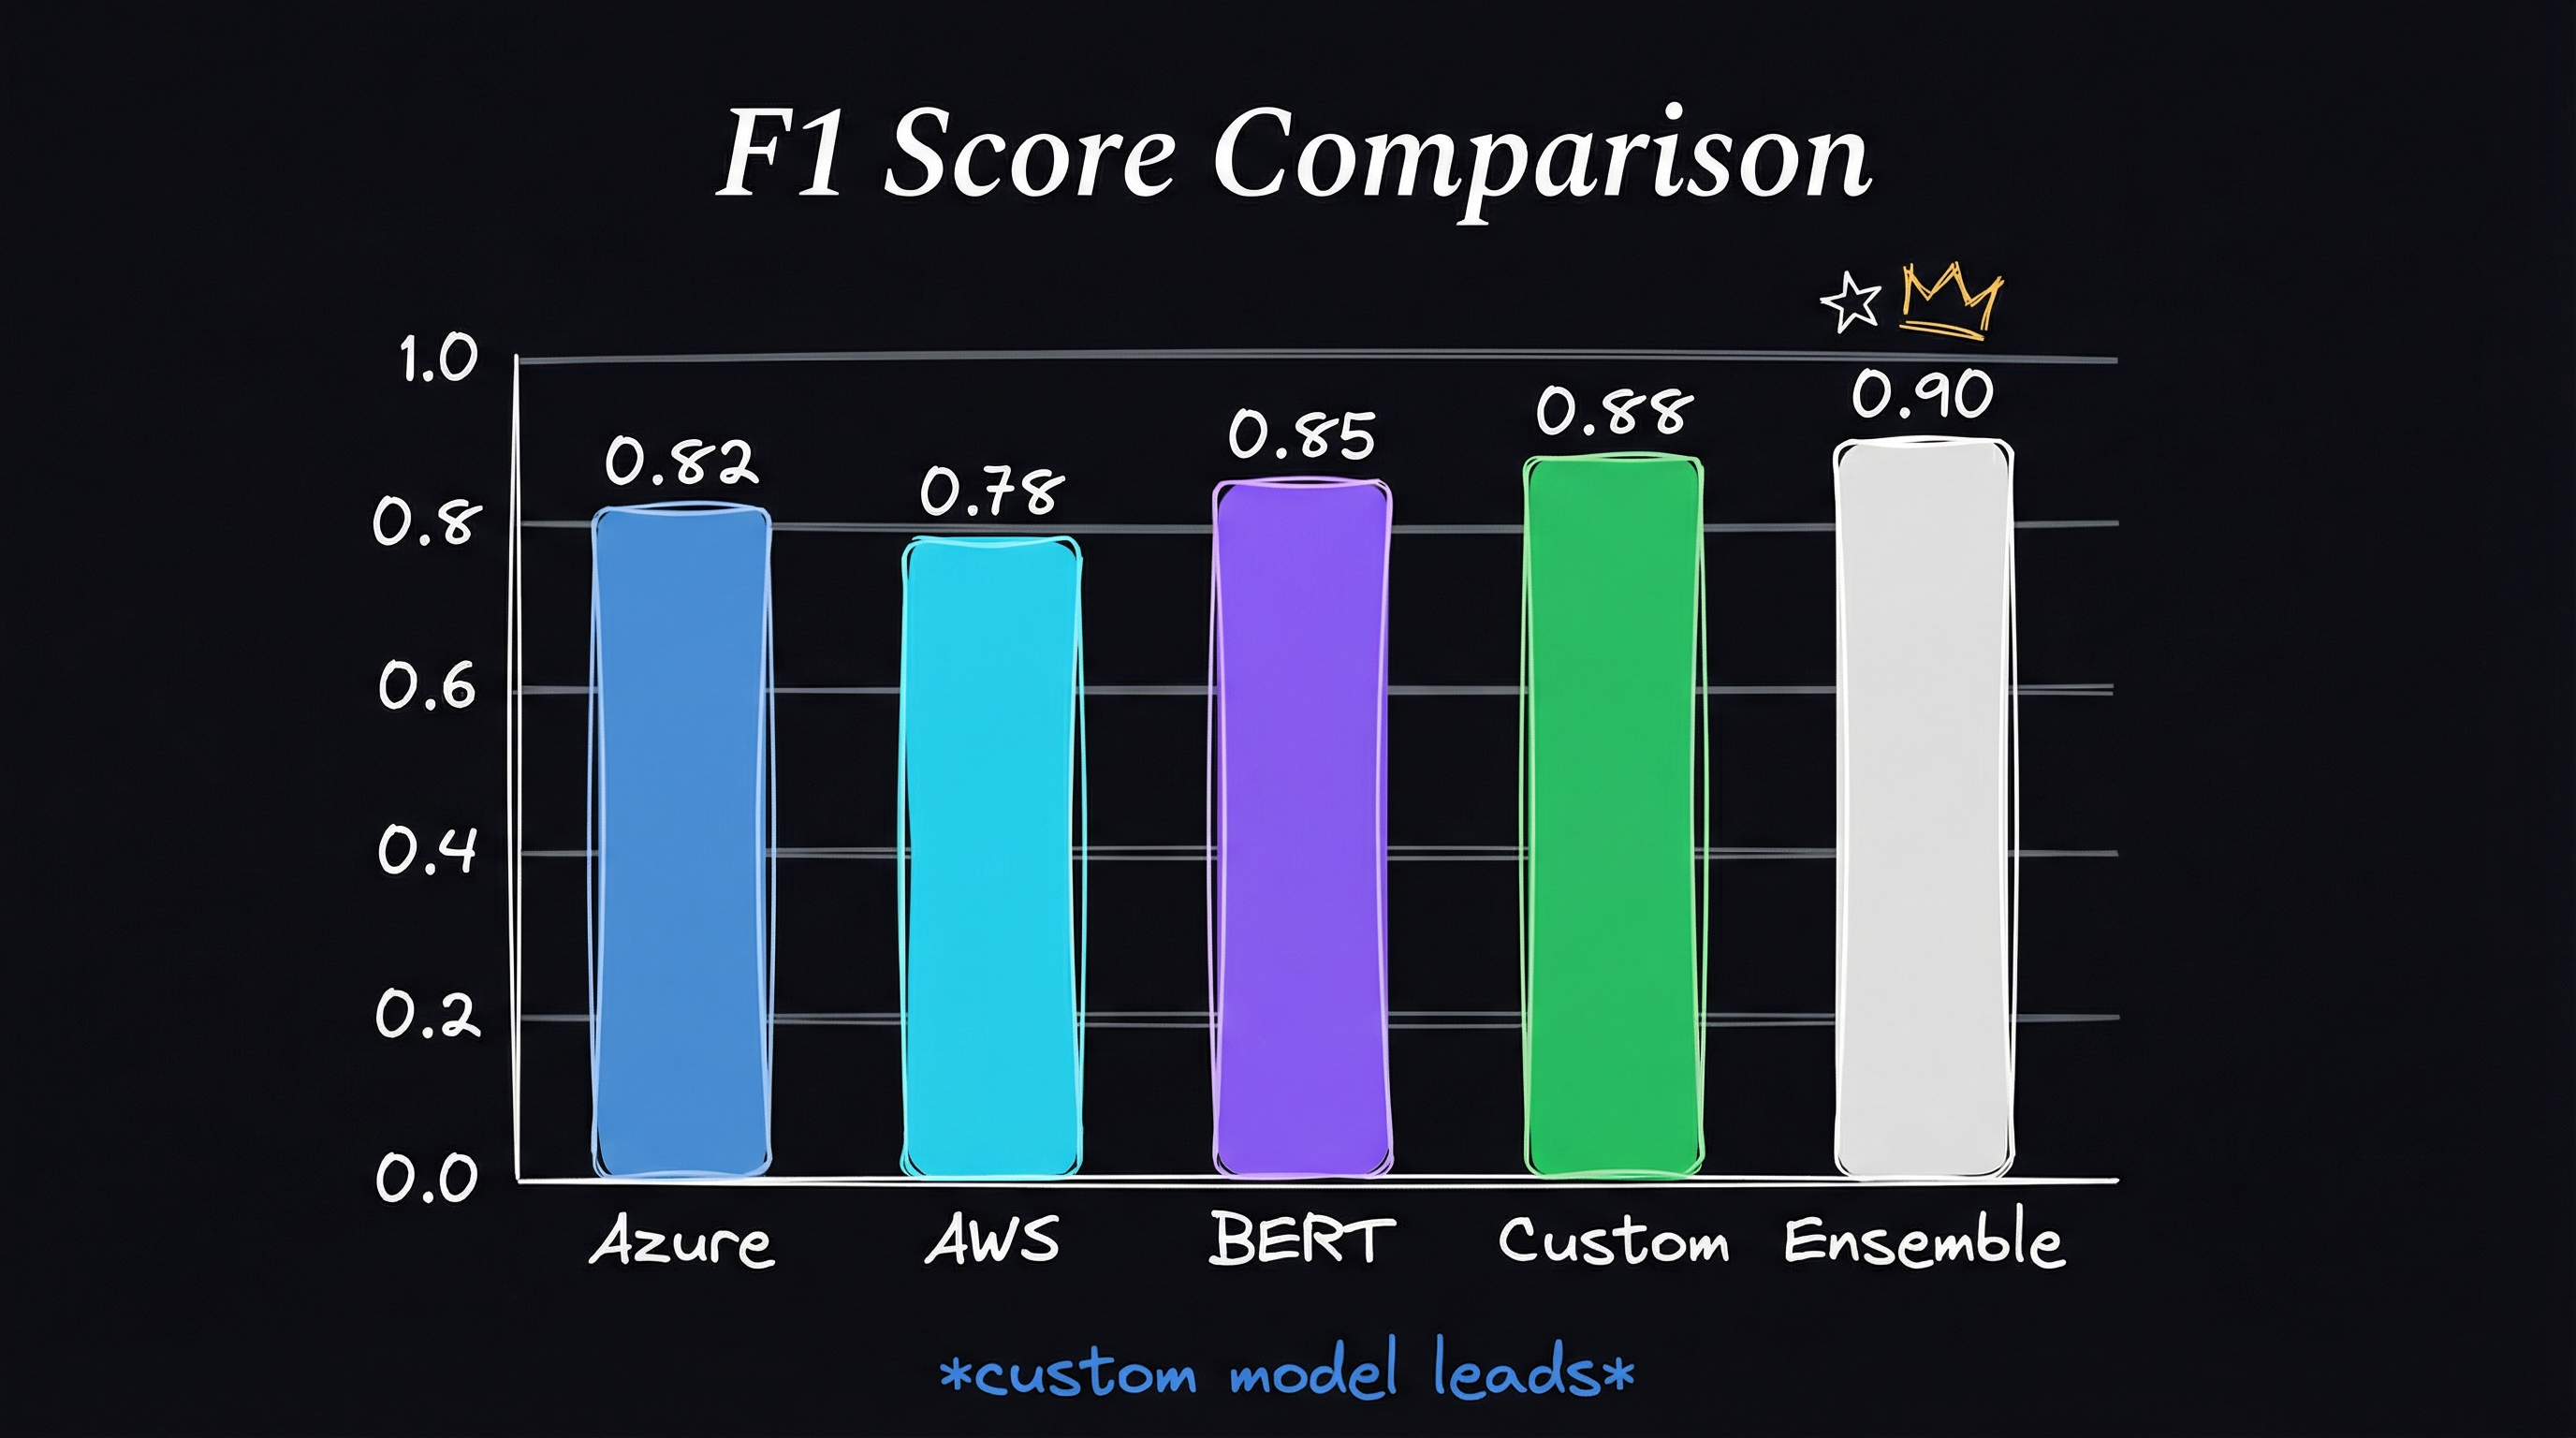
Figure-7: F1 Scores
The agreement analysis told the same story from a different angle.
Fine-tuned RoBERTa and fine-tuned Phi-2 agreed with each other 90.84% of the time — the highest agreement in the entire matrix. Fine-tuned models consistently agreed more with each other than with any cloud API. Azure and raw Phi-2 had the lowest agreement, which is what you’d expect when two models are systematically wrong in different directions.
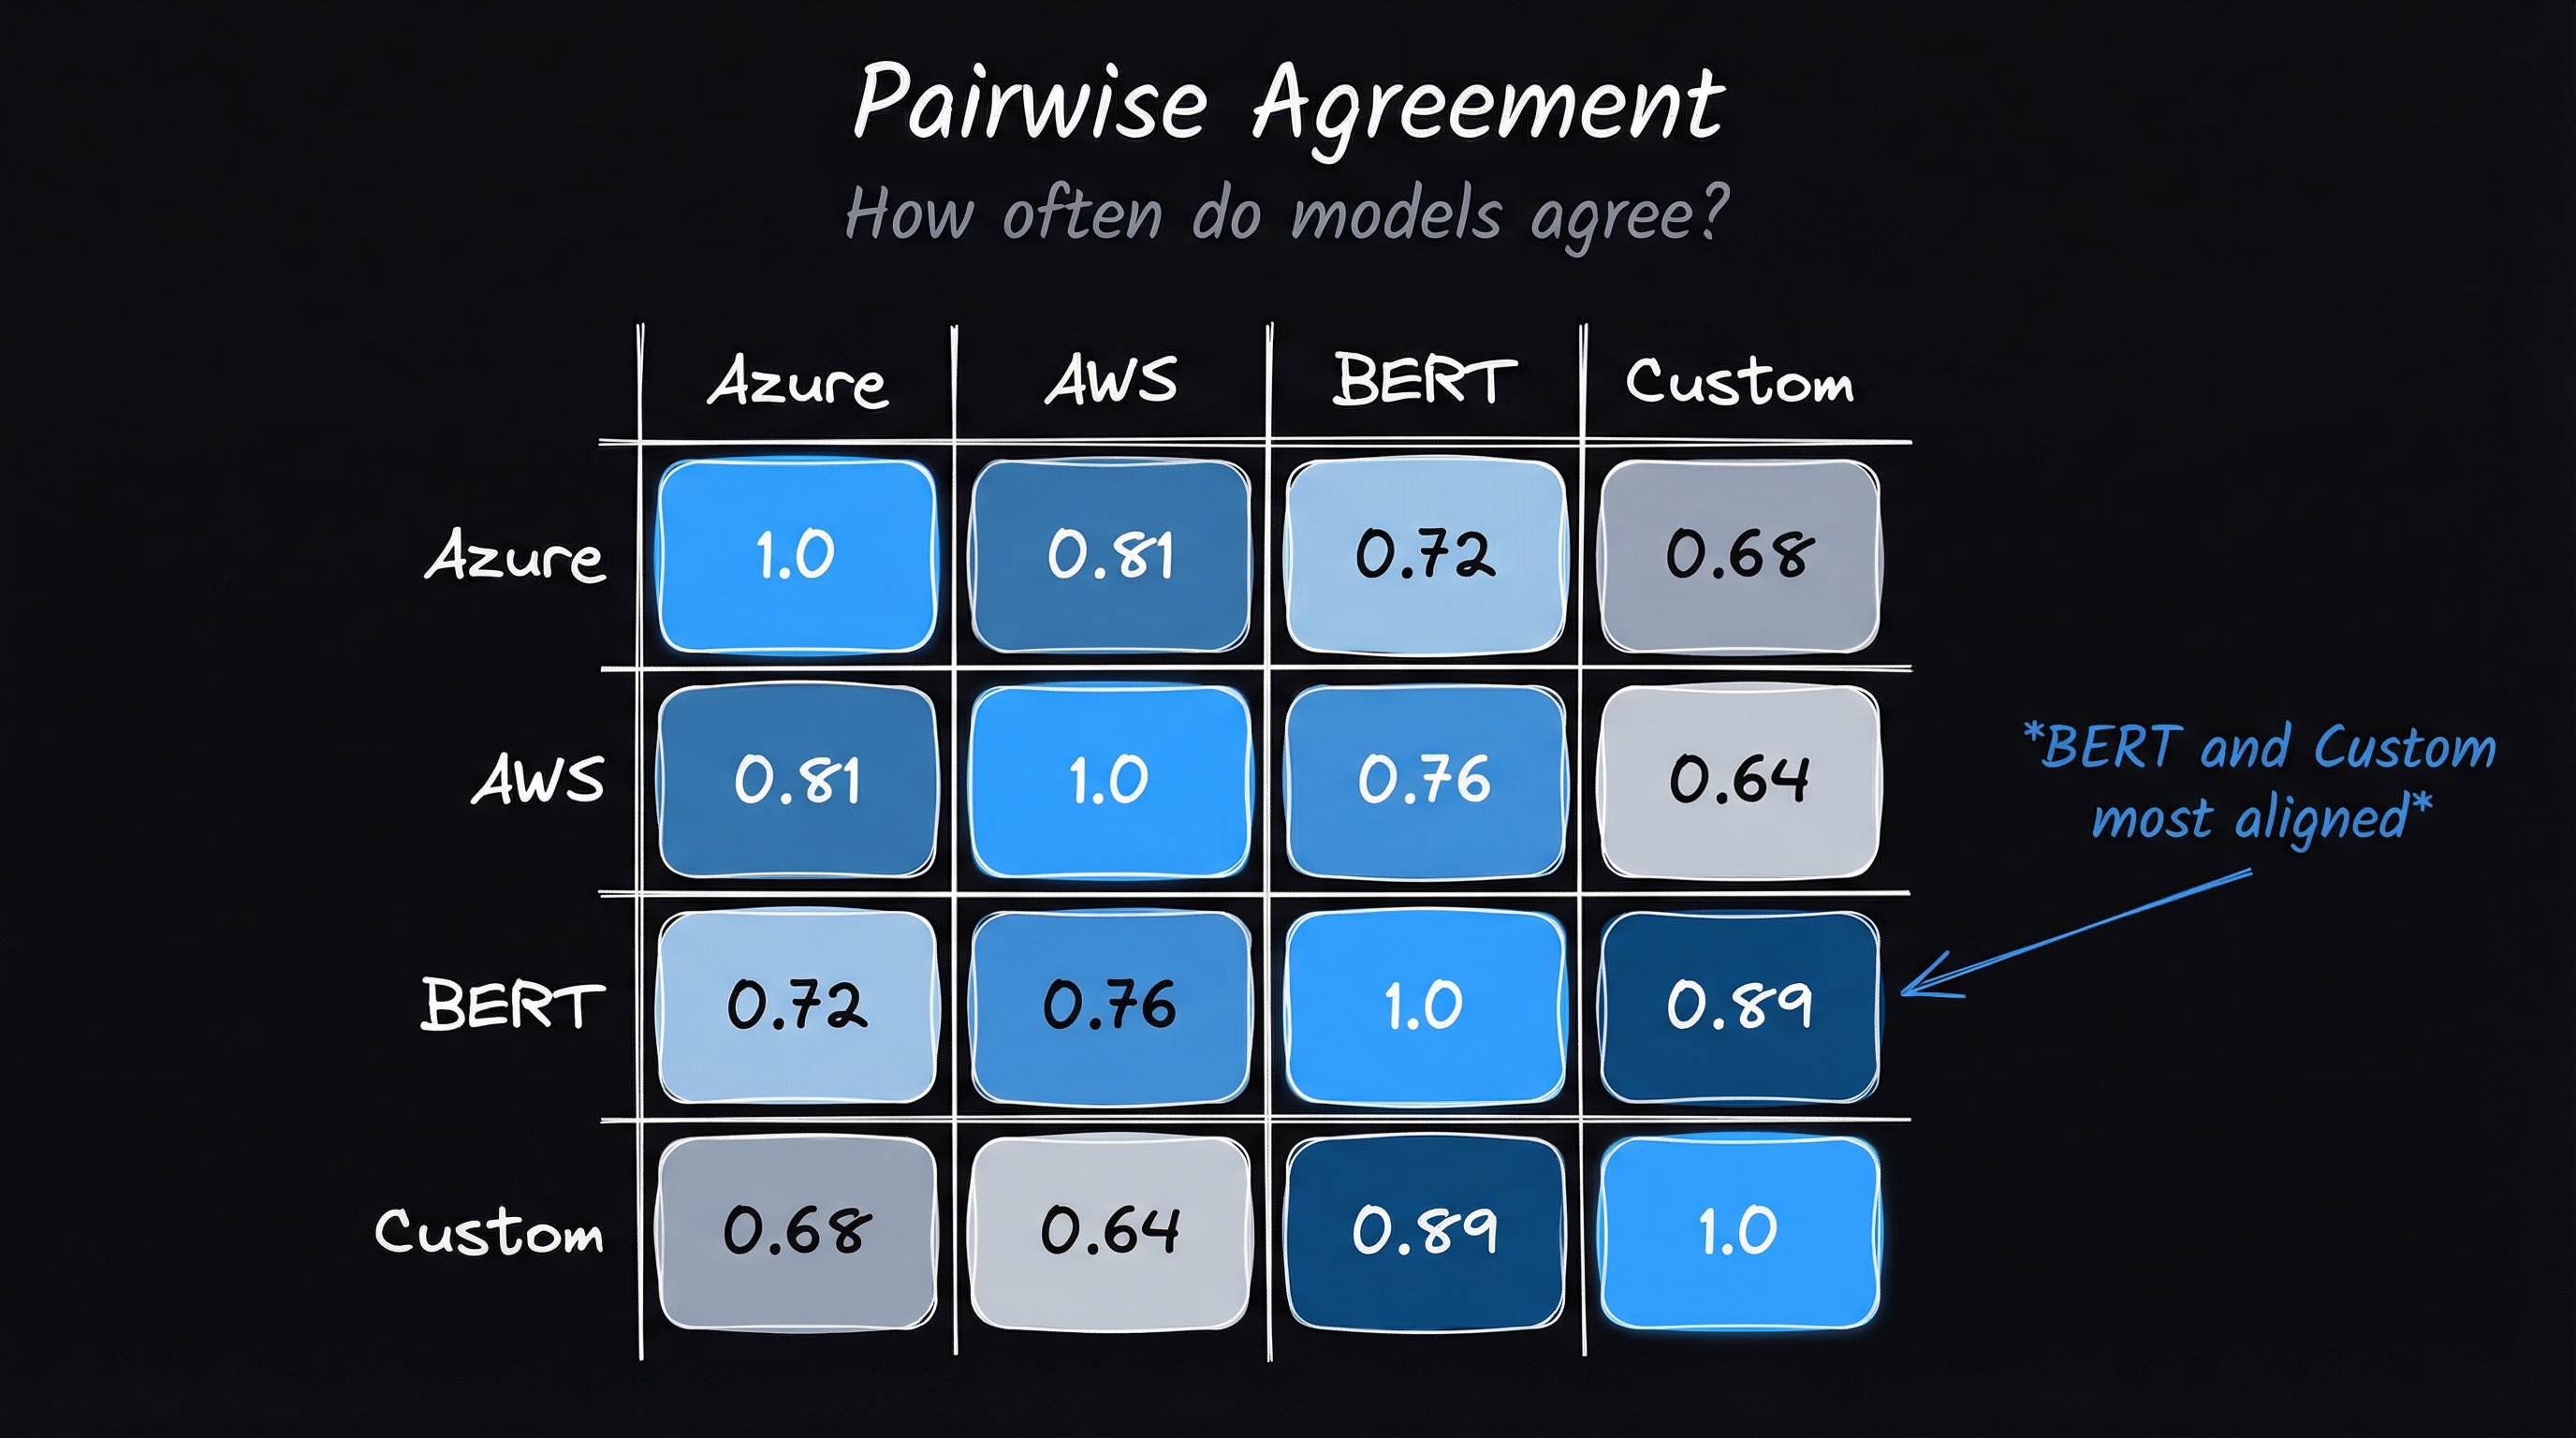
Figure-8: Pairwise agreement analysis
The takeaway
The cloud APIs — Azure Cognitive Text Analytics and AWS Comprehend — are easy to integrate but wrong in ways a single accuracy number won’t surface. Their sentiment distributions don’t match the ground truth, which means they’re misclassifying systematically, not randomly. If you’re making decisions off this data, you’re making them off a distorted picture.
Fine-tuning a Transformer model on your own data is the reliable path. It took 22,719 labeled examples here, but the literature suggests meaningful improvement is feasible with as few as 20,000. The trained model learns the shape of your data — not the shape of a general-purpose API calibrated on product reviews and social media posts that look nothing like your domain.
If you’re optimizing for F1 score — and if sentiment classification affects revenue, operations, or decisions — build the custom model. The APIs are a starting point, not the destination.
In the next post, I walk through exactly how to fine-tune Phi-2 for your own sentiment task (link here).